
Climate Change in the Kurdistan Region and Iraq; Carbon Dioxide Emission and Air Quality
18-09-2023
Introduction
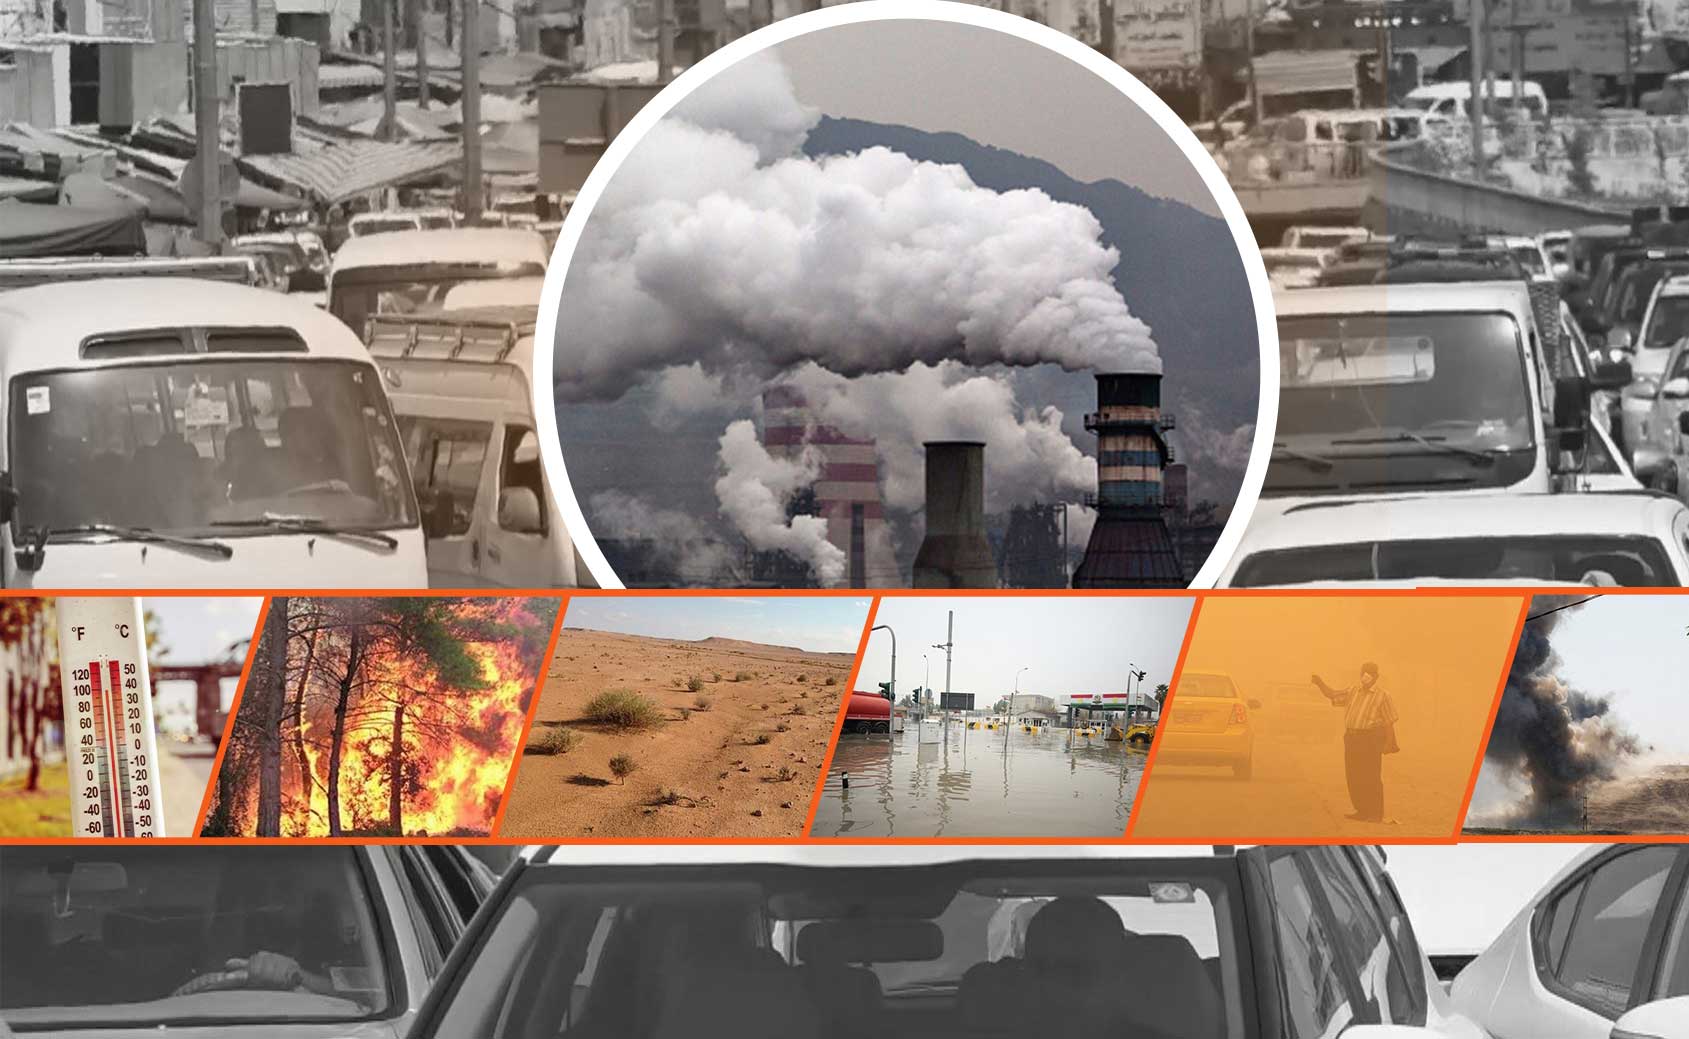
Carbon dioxide emissions play a pivotal role in shaping the course of climate change, notably contributing to global warming, elevated temperatures, and air quality concerns. While the United Nations designates September 7 as Clean Air and Blue Skies Day annually, the latest report from the UN Secretary-General delivers sobering news: an alarming 99% of the world's population continues to breathe polluted air. This distressing reality underscores the pressing need for concerted global efforts to address air quality issues.
In 2021, Iraq's carbon dioxide emissions surged to a staggering 177.8 million tons, marking an alarming increase of nearly sevenfold compared to a mere 27.1 million tons emitted over the previous five decades.
Another facet of carbon dioxide emissions relates to air quality, as highlighted in the latest annual report from the World Air Quality Index (WAQI). Iraq stands out, unfortunately, as having the second most polluted air among 131 countries. When assessing air quality within 7,323 cities globally, Baghdad emerges as the 13th most polluted city, solidifying its status as one of the world's most heavily polluted urban centers. Meanwhile, Erbil ranks 336th in this distressing ranking.
The primary contributor to carbon dioxide emissions is the combustion of fossil fuels. However, in Iraq, an additional source of carbon dioxide emissions stems from the combustion of gas flaring during oil production.
As per the International Energy Agency (IEA), Iraq annually burns 17 billion cubic meters of natural gas, contributing to air pollution in oil-producing cities. According to a study conducted by the University of Windsor in Canada, a significant reduction of 50 million tons in carbon dioxide emissions could be achieved solely by transitioning electricity generation systems.
In Iraq, the two most prominent contributors to carbon dioxide emissions are electricity generation and transportation. Between 1990 and 2021, there was a substantial 371% increase in emissions from electricity generation and a 34% increase in emissions from the transportation sector. In contrast, European countries witnessed a 31% reduction in emissions from electricity generation and a 16% increase in emissions from the transportation sector during the same period.
In the realm of public health, the detrimental effects of air pollution in Iraq and the Kurdistan Region have become evident, as evidenced by a continuous rise in the number of cancer cases. For instance, in Basra Province, there has been a 20% increase in cancer cases over a span of three years. Similarly, in the Kurdistan Region, the incidence of cancer cases has doubled between 2020 and the present year.
Iraq's Carbon Dioxide Emissions: A Detailed Study of Fuel Combustion on National and Individual Levels
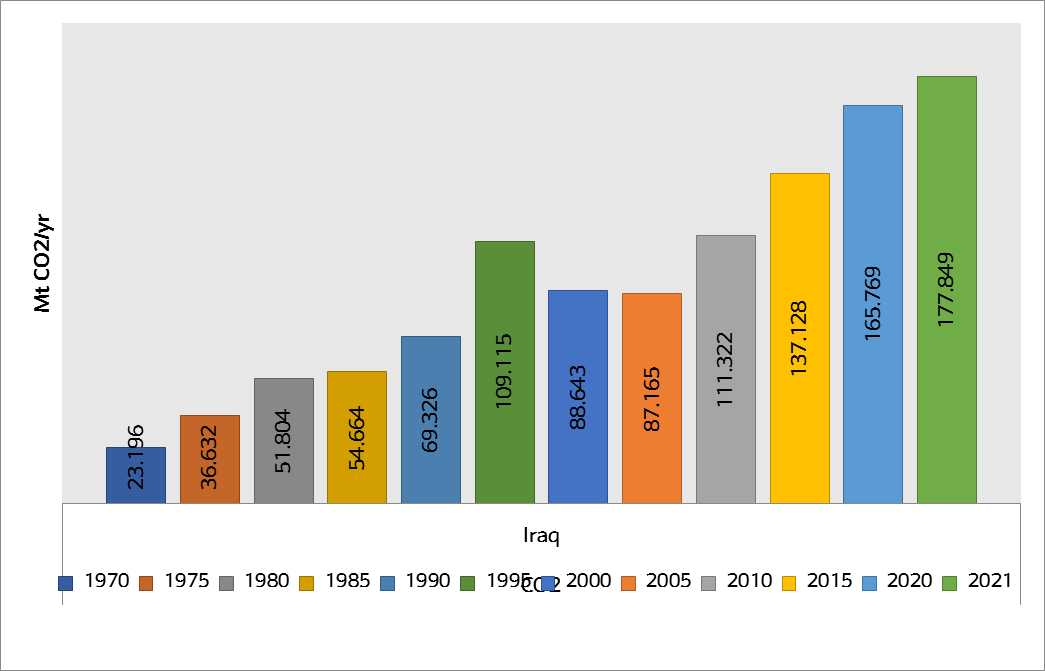
Over the last five decades, Iraq has undergone profound transformations, marked by a remarkable surge in carbon dioxide emissions. In recent years alone, these emissions have surged from 88.6 million tons in 2000 to a staggering 177.8 million tons in 2021, representing a remarkable 100% increase. In contrast, the European Union has managed to reduce its emissions by 22% during the same period. Globally, there has been a substantial overall increase of 46.5% in carbon dioxide emissions.
Graph 1: Indicator of carbon dioxide emissions from fuel combustion from 1970 -2021 /million tons per year
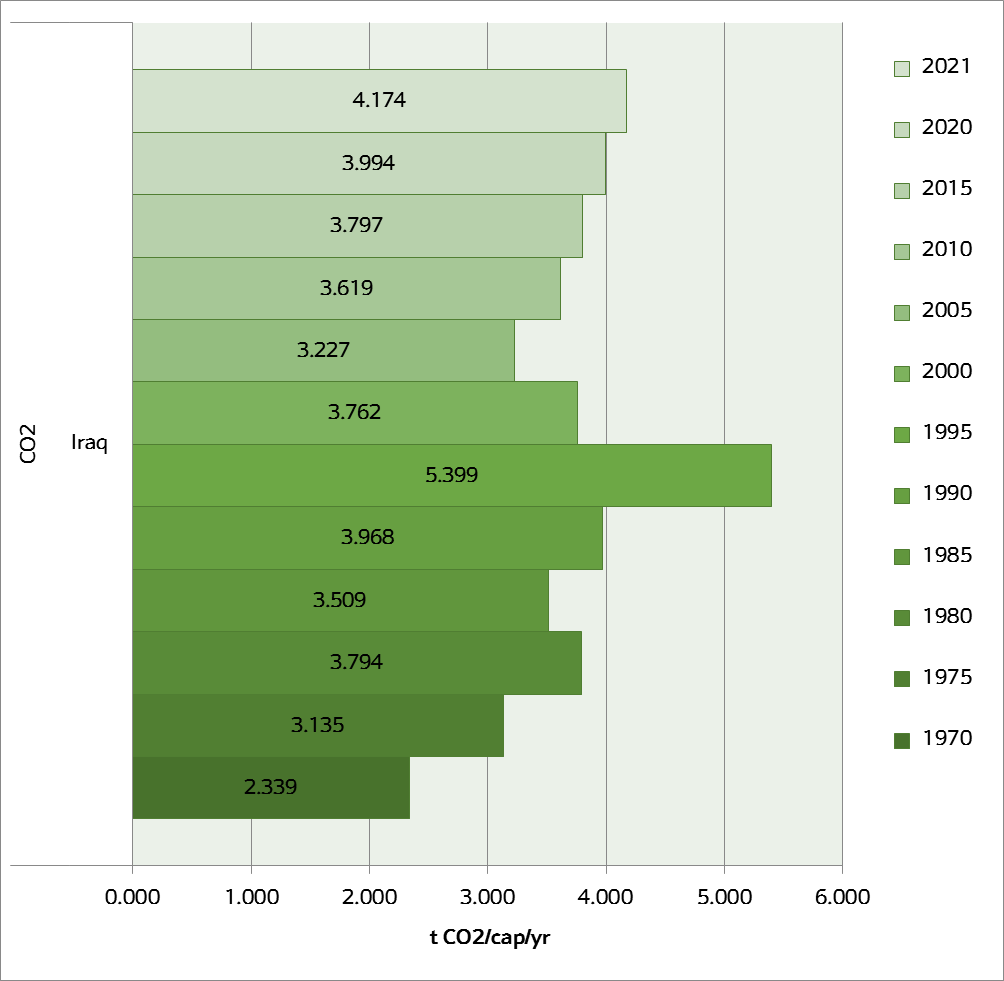
The per capita carbon dioxide emissions from fuel combustion in Iraq have remained relatively stable, with a modest increase from 3.7 tons per capita in 2000 to 4.1 tons in 2021, reflecting a mere 10% rise. You can refer to the second graph for a visual representation of this data.
Graph 2: Carbon dioxide emission indicators from fuel combustion per capita from 1970 -2021 /million tons per year
Iraq's Diverse Sectorial Carbon Dioxide Emissions
Iraq's trajectory of carbon dioxide emissions from the combustion of fossil fuels for energy stands in stark contrast to many other nations, especially European countries. Over the past three decades, Europe has notably reduced its reliance on fossil fuel products, resulting in a significant reduction of up to 40% in carbon dioxide emissions. Conversely, Iraq has witnessed an increase in emissions across all sectors.
This disparity underscores two critical factors contributing to the rising carbon dioxide emissions in Iraq. Firstly, there is a heavy dependence on carbon-intensive sources and traditional energy within various sectors. Secondly, the lack of source of carbon dioxide exchange for oxygen, leading to diminished green spaces and an increase in desertification. Despite the Prime Minister's announcement at a climate conference in Basra, pledging to plant 5 million trees, it's worth noting that, according to the Ministry of Finance, no funds have been allocated to investment projects within the Ministry of Environment as of the end of June.
In Iraq, carbon dioxide emissions stemming from fuel used for cooling or heating buildings have surged to 2.17 million tons annually, marking a substantial 136% increase over the past three decades. In stark contrast, the European Union has witnessed a 41% decline, while the rest of the world has experienced a 65% increase in similar emissions.
Owing to the limitations of public transportation in Iraq, carbon dioxide emissions from public transportation fuels are projected to reach 34.55 million tons per year in 2021. This represents an overall increase of 157% over the past three decades, while the EU has managed to reduce these emissions by 32%, and the global increase stands at 2%. Please refer to Table 1 for a comprehensive breakdown of these disparities.
Table 1: Indicators of changes in carbon dioxide emissions from combustion in different sectors between Iraq, Europe and the world 1990-2021
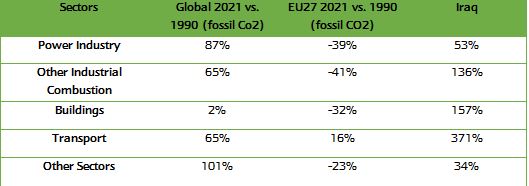
Furthermore, as illustrated in Table 1, the surge in emissions can be attributed primarily to the industrial sector, driven by oil production and the combustion of gases in Iraq.
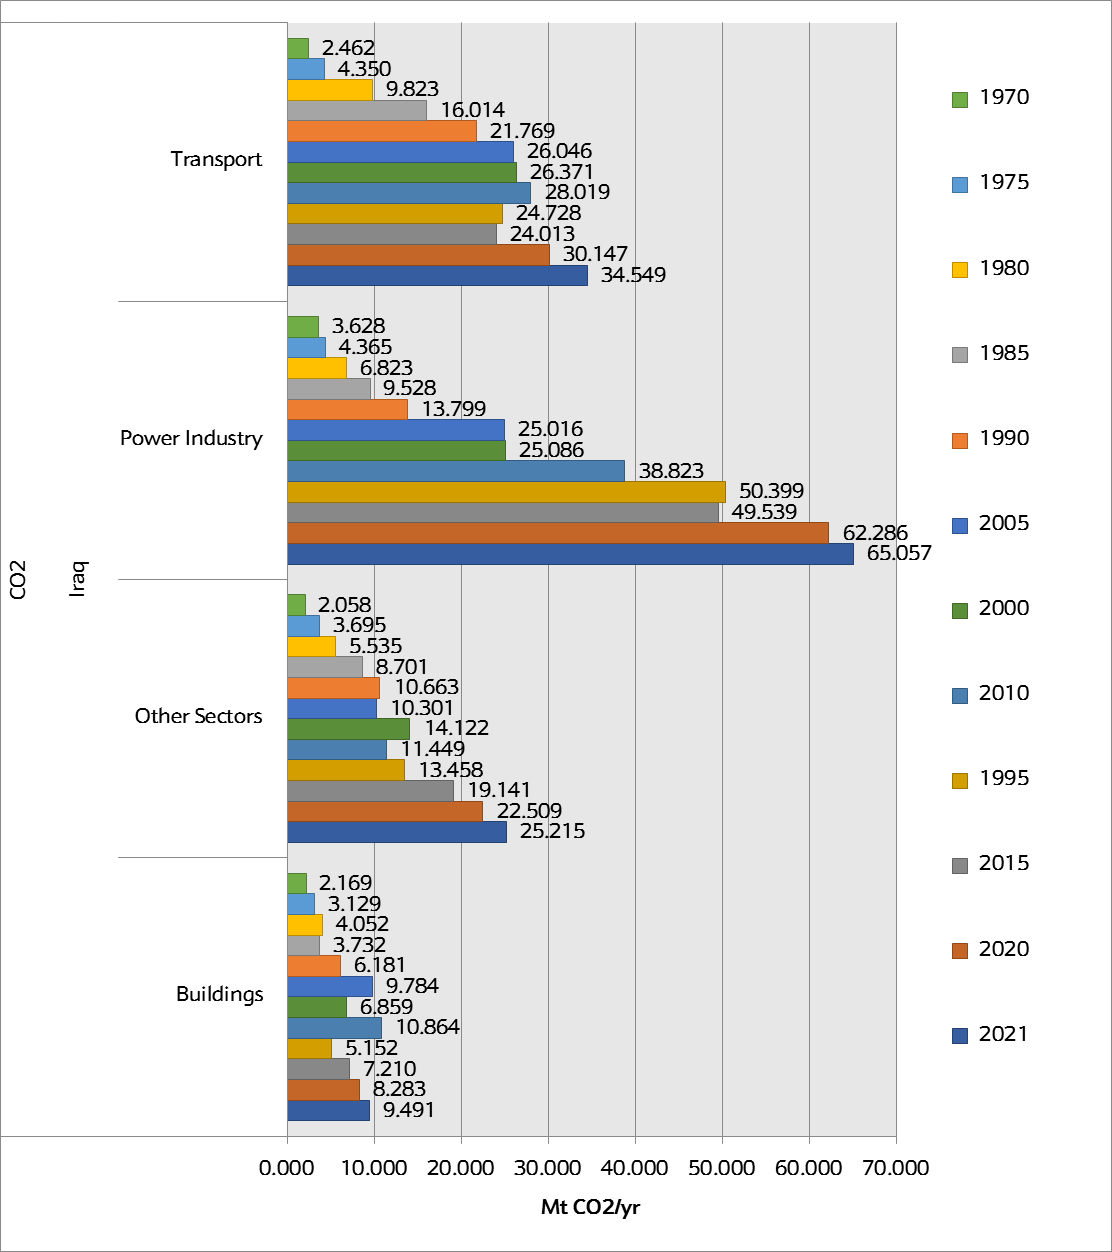
Additionally, the principal contributors to carbon dioxide emissions and air pollution in Iraq can be traced back to two key sectors: electricity generation and transportation. Notably, the electricity generation sector has witnessed a notable escalation, surging from 25.086 million tons in 2000 to a significant 65.057 million tons in 2021. Simultaneously, the transportation sector has seen an increase, rising from 26.3 million tons in 2000 to 34.59 million tons in 2021.
Graph 3: Carbon dioxide emissions from fuel combustion for various sectors 1970-2021
Origins and Quantities of Carbon Dioxide in Earth's Atmosphere
Regarding the origins of carbon dioxide emissions, as per the IPCC, there exist over 7,500 significant sources of carbon dioxide emissions across the globe, releasing more than 0.1 million tons annually. These emission sources exhibit geographical diversity, and projections underline a surge in carbon dioxide emissions by 2050, particularly from both the industrial sector and power plants.
According to NASA, carbon dioxide in Earth's atmosphere plays a pivotal role in causing global warming and driving climate change. What's particularly noteworthy is that human activities have amplified carbon dioxide levels in the atmosphere by an astonishing 50% over the past 200 years. This means that the current carbon dioxide concentration stands at 150% of what it was in 1750. This human-induced surge is significantly more substantial than the natural fluctuations that occurred at the end of the last ice age, approximately 20,000 years ago.
According to the same source, alterations in the presence of carbon dioxide in Earth's atmosphere are now visually discernible through changing colors over time. For instance, in 2002, there were only 365 parts of carbon dioxide per million parts of air. The term "parts per million" signifies the number of carbon dioxide molecules per million molecules of dry air. This measurement is taken from the middle of the troposphere, an atmospheric layer situated approximately 8-12 kilometers (about 5-7 miles) above the Earth's surface. These data unequivocally illustrate a substantial surge in the concentration of carbon dioxide in the atmosphere, underscoring the profound impact of human activities on Earth's climate.
Iraq's Air Quality; Second Worst in the World
In March 2023, Air Quality Technology unveiled its annual publication, "World Air Quality Report 2022," an extensive assessment of air quality across 131 countries and 7,323 cities. This comprehensive analysis draws upon data collected from 30,000 air quality monitoring stations and sensors, in collaboration with government agencies, NGOs, research centers, and various stakeholders. The report primarily relies on PM2.5 air quality data, which pertains to airborne particles with a diameter of 2.5 microns or less, recognized as hazardous air pollutants.
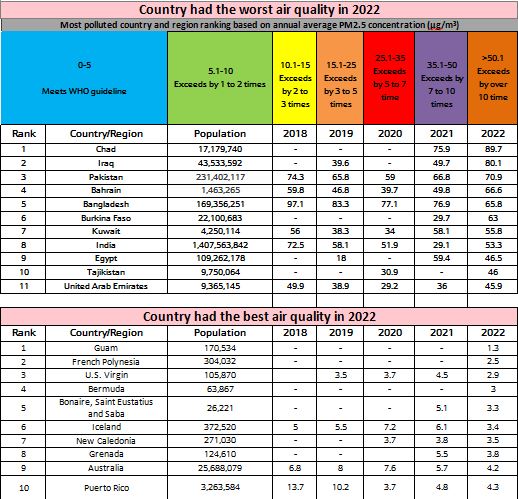
IQ Air, which consistently gathers data from both capital cities, Baghdad and Erbil, has projected that Iraq experienced unhealthy air quality conditions in 2022. The average PM2.5 concentration in Iraq is staggering, surpassing the World Health Organization's air quality standards by a staggering 16-fold. Disturbingly, Iraq holds the position of being the second most polluted country globally, trailing only behind Chad. This disconcerting trend reveals a consistent year-on-year escalation in air pollution, a remarkable index score of 80.1 in 2022, well above the World Health Organization's prescribed air quality standards.
Table 2: Top Ten Most Polluted and Cleanest Countries in Air Quality for 2022
Air quality in Baghdad and Erbil among more than 7,000 cities in the world
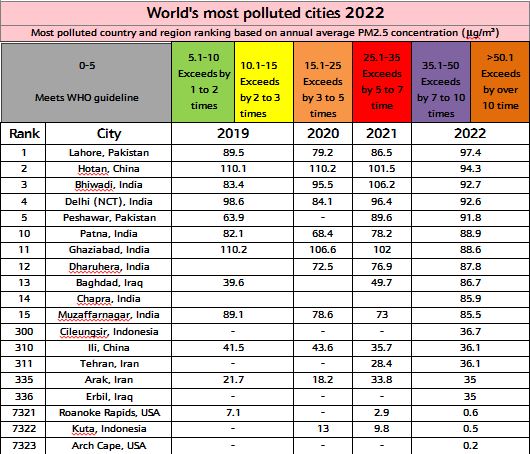
According to the World Air Quality Report, out of the 7,323 cities globally assessed, the title of the world's most polluted city for 2022 goes to Lahore in Pakistan, while the cleanest city is ARK-i Labs in the United States. In the same report, Baghdad takes the 13th position, while Erbil ranks 336th among these 7,000+ cities in terms of air pollution levels. It's noteworthy that Baghdad's air quality exceeds the World Health Organization's standards by more than 10 times, and Erbil 5 to 7 times.
When assessing urban air quality, PM2.5 levels are typically measured in terms of the average annual concentration, expressed as milligrams per cubic meter (mg/cubic meter). According to WHO guidelines, ideal air quality falls within the 0-5 PM2.5 range. If the PM2.5 levels register between 5.1-10, it signifies that the air quality exceeds WHO's recommended standards by one to two times.
Table 3: Global air quality in more than 7,000 cities.
Source: World Air Quality IQAir, September 5,2023
Conclusion
According to a World Bank report, the economic costs and health impacts linked to carbon dioxide-induced air pollution are steadily rising each year. This translates to a staggering $8.1 trillion, equivalent to 6.1% of the global GDP's growth.
According to the research on disease conditions, reveals that in 2019, air pollution was responsible for 6.4 million premature deaths worldwide, marking the highest death rate due to air pollution in the past decade. These alarming statistics underscore the profound health, social, and economic consequences of air pollution, prompting the World Bank to extend its support to countries worldwide in their efforts to combat this pressing issue.
In Iraq, the direct health impact of carbon dioxide emissions and air pollution in cities like Basra is evident. According to a report spanning from 2015 to 2018 by the Iraqi Ministry of Health, cases of cancer attributed to oil-related air pollution increased by 20%, tripling the previously reported numbers. In the Kurdistan Region, an alarming 3,000 new cancer cases have been recorded in just the past six months.
The escalating carbon dioxide emissions and air pollution in Iraq undoubtedly pose a significant and urgent risk to its population, demanding immediate attention and action.
This report constitutes the third installment of a six-part assessment on climate change, soon to be featured in Rudaw's opinion section. In this segment, the author not only takes a stance on climate change but also presents compelling data that highlights the perils of climate change in Iraq and the Kurdistan Region.
Click here to read Part 2, Climate Change in the Kurdistan Region and Iraq; Destruction of trees, fires and burning of trees
Reference:
Annex I: Properties of CO and carbon-based Fuels Annex I - IPCC. Available at: https://www.ipcc.ch/site/assets/uploads/2018/03/srccs_annex1-1.pdf (Accessed: 20 August 2023).
Sources of CO2 - IPCC. Available at: https://www.ipcc.ch/site/assets/uploads/2018/03/srccs_chapter2-1.pdf (Accessed: 20 August 2023).
Carbon dioxide concentration (2023) NASA. Available at: https://climate.nasa.gov/vital-signs/carbon-dioxide/ (Accessed: 23 August 2023).
World Bank. 2020. The Global Health Cost of Ambient PM2.5 Air Pollution. © World Bank, Washington, DC. http://hdl.handle.net/10986/35721 License: CC BY 3.0 IGO
H Al-Fehdly, W ElMaraghy, S Wilkinson,Carbon Footprint Estimation for Oil Production: Iraq Case Study for The Utilization of Waste Gas in Generating Electricity, Procedia CIRP, Volume 80,2009, Pages 389-392, ISSN 2212-8271, https://doi.org/10.1016/j.procir.2019.01.029
[1] Carbon dioxide emissions are emissions from the combustion of fuels such as coal, oil and natural gas, cement production, wood burning, and the natural processes of volcanic eruptions.